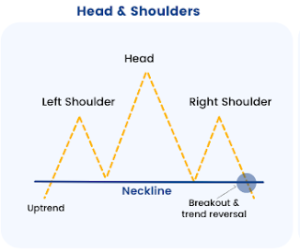
Certainly! The head and shoulders chart pattern is a popular technical analysis pattern used by traders and analysts to identify potential trend reversals in financial markets. It is considered a reliable pattern and is widely used in stock trading, forex trading, and other markets.
The head and shoulders pattern consists of three peaks or highs, with the middle peak (the head) being higher than the other two (the shoulders). The peaks are separated by two troughs or lows, with the trough between the left shoulder and the head being higher than the trough between the head and the right shoulder. Visually, the pattern resembles a human head with two shoulders.
The head and shoulders pattern can occur in both uptrends and downtrends, and it signals a possible trend reversal. Here’s how the pattern is formed and what it typically indicates:
Left Shoulder:
The pattern starts with an initial peak (a high point) called the left shoulder. This peak is formed as the price rises to a certain level and then retraces back down, forming a trough or low.
Head:
After the left shoulder, the price rallies again, surpassing the previous peak to form the highest peak in the pattern, known as the head. The subsequent retracement creates a higher trough compared to the trough between the left shoulder and the head.
Right Shoulder:
Following the head, the price declines once more but finds resistance near the level of the left shoulder. This creates a third peak, known as the right shoulder. The trough formed between the head and the right shoulder is usually higher than the trough between the left shoulder and the head.
The neckline is an important element of the pattern. It is a trendline that connects the lows between the left shoulder, head, and right shoulder. The neckline acts as a support level for the price during the formation of the pattern.
When analyzing the head and shoulders pattern, traders look for a specific confirmation of a trend reversal. This confirmation occurs when the price breaks below the neckline after the formation of the right shoulder. The breakdown of the neckline suggests a potential shift from an uptrend to a downtrend.
The distance from the head to the neckline is often used to estimate the potential downward move once the pattern is confirmed. Traders measure this distance and project it downward from the neckline breakout point to determine a possible target for the price decline.
It’s worth noting that head and shoulders patterns can sometimes appear in variations, such as inverted head and shoulders, where the pattern indicates a potential bullish reversal in a downtrend.
As with any technical analysis tool, it’s essential to combine the head and shoulders pattern with other indicators and factors to increase the accuracy of your analysis and trading decisions.


